Malls manage footfall across many tenants, zones and levels, with marketing spend and tenant performance hard to connect. Integrated Retail helps mall operators see traffic, conversion and tenant mix together.
Mall operators often can’t see tenant-level sales and performance in one place.
Traffic is tracked, but it’s unclear which zones and levels actually convert.
Every tenant runs its own systems, making mall-wide reporting difficult.
It’s hard to know which zones hold shoppers longest and why.
Connecting campaigns and events to actual footfall and tenant sales is difficult.
How many potential customers can I attract?
Footfall + Traffic
How many purchase?
Transactions + Vision
Did we have what they wanted?
Size / Category / SKU Availability
Did staff and operations support the opportunity?
Sales per Labour Hour / Queue / Service
How footfall, tenant and traffic data get used across the concerns that actually drive mall management decisions.
Brings zone-level footfall and conversion data into rent-review and renewal conversations, so asking rates are backed by measured traffic rather than the tenant’s word against the landlord’s.
A defensible, data-backed position at every rent review — for units earning their space and units that aren’t.
Malls that bring footfall data into renewal negotiations typically reach a stronger position at the table and catch under-performing units earlier in the lease cycle. Directional, illustrative — not a guaranteed figure.
Measures whether a campaign or event actually moved footfall and dwell time — not just impressions or attendance — and breaks that down by zone and day-part.
Marketing spend justified and directed by measured footfall impact, not assumption.
Example: reallocating part of a quarter’s event budget toward the zones and day-parts shown to actually respond to it. Illustrative, not a committed figure.
Compares footfall, occupancy and tenant sales trends across zones — or across multiple malls in a portfolio — in one dashboard instead of collating separate reports.
A single, current view of which assets, zones and tenant categories are genuinely earning their space.
Example: spotting one consistently under-performing zone or asset within a single quarterly review, ahead of the next lease-renewal cycle. Illustrative example, not one customer’s reported result.
Uses real-time and historical traffic data to plan peak-hour staffing, queue management and crowd-density monitoring across entrances, escalators and common areas.
Smoother peak-period operations and a documented basis for staffing and crowd-management decisions.
Example: adjusting weekend staffing rosters around measured hourly footfall peaks instead of a flat schedule. Illustrative example.
Traces how visitors actually move through the mall — entrance to zone to dwell time to exit — to see where the journey breaks down between arriving and spending.
Layout, wayfinding and tenant-placement decisions grounded in how shoppers actually move, not assumption.
Example: identifying a high-footfall zone with unusually short dwell time, pointing to a layout or tenant-mix issue rather than a traffic problem. Illustrative example.
For shopping malls, the single highest-leverage platform is traffic and location analytics. Individual tenants may run their own POS, CRM or inventory systems — but tenant-mix strategy itself runs on footfall data.

Where a tenant also needs its own POS, CRM or unified-commerce systems, Integrated Retail supports that too — but for the mall operator itself, FootfallCam is the platform this page is built around.
Explore FootfallCam →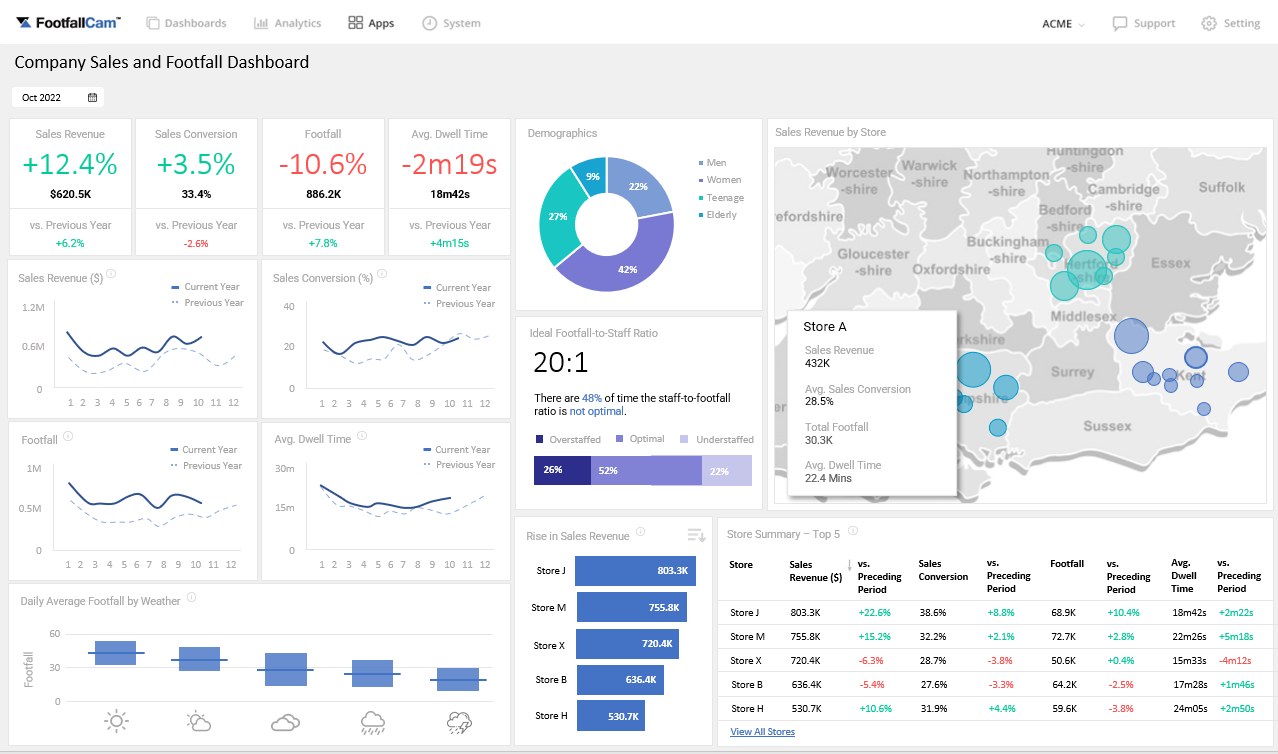
Illustrative example dashboard — shown to demonstrate how connected reporting looks in practice, not one customer’s actual reported figures.
Illustrative example — three zones with an identical tenant sales drop, and three different root causes and responses once footfall and dwell time are seen together.
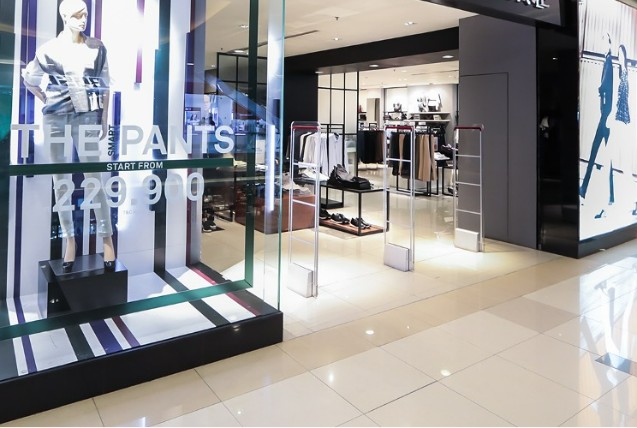
Challenge: A fashion house with a growing collection of mall-based sub-brands needed one consistent operating backbone across an expanding store network.
Solution: Cegid POS, WMS & inventory, CRM, omnichannel and shop-in-shop deployment, integrated with SAP.
Outcome: 550+ mall-based stores running on one connected system across Indonesia, and continuing to expand.
View Case Study →
Challenge: One of Thailand’s largest distributors of fashion and lifestyle brands, operating extensively through mall-based retail points, needed systems tailored to a fast-moving, multi-brand business.
Solution: Cegid POS, inventory management, CRM & CLM, promotions and business reporting.
Outcome: 350+ mall-based retail points running on a consistent operating model since 2020.
View Case Study →See the retailers, brands and store networks across Asia Pacific already running on our systems.
View All Case Studies →Local expertise across zones, levels and tenant categories.
Footfall, dwell time and conversion managed with precision.
Works with leading retail technology partners.
Connects mall, tenant and marketing operations for complete visibility.
Asia-based team with proven retail domain expertise.
Let’s find out together — talk to our team about your tenants, your zones and your systems.